There is much more to the world around us than we can see. And this isn't a strange fact about the external world; it's a strange fact about your eyes.
Most human beings, like many other animals, use light-sensitive organs to gather data about the world around us. The light that we see is electromagnetic radiation, but only a tiny fraction of the many frequencies of electromagnetic radiation in the world are visible to our eyes.
Advertisement
Other frequencies of radiation are no less physically real than the colors of light that we can see. Radio waves, infrared, ultraviolet, X-rays and gamma rays are all bouncing around between us and our environment every day. They are the unseen traffic of everyday physics. If we could see them, they would undoubtedly play an important role in the way we experience reality.
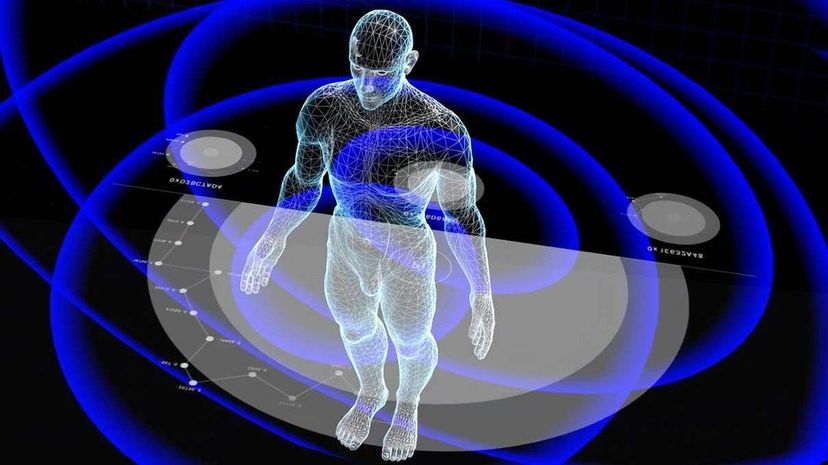
For example, imagine if you could see the photons pouring out of your Wi-Fi router the same way you see yellow light pouring out of the bulb in your desk lamp. Some artists have tried to show what the world would look like if our eyes were sensitive to the microwave frequencies that our wireless networks occupy, and it does make for a startling picture of human civilization.
If you could see these networks, there would no longer be any mystery about why your laptop suddenly can't get a signal – the difference would be as obvious as walking from a well-lit room into a place of darkness.
In 2014, a software engineer and artist named Daniel Jones and a science writer named Frank Swain worked together to develop a tool for making Wi-Fi signals perceptible — not through vision, but through hearing. It's called Phantom Terrains, and it translates the invisible clouds of data that constantly surround us into ambient sound that is relayed through a pair of hearing aids. So as you walk through a city or an office building wearing these hearing aids, you perceive a fluctuating collage of clicks, hums and rattles as the phone in your pocket shakes hands with all of the routers in the area.
Sure, we may not need constant sensory updates on the strength and diversity of Wi-Fi signals in order to survive, but it does provide a different and more intuitive way of grappling with real facts about our physical surroundings.
However, it's not just invisible electromagnetic radiation that we can add to our sensory diet. Any data that can be represented numerically can potentially be turned into sensory feedback. So what if, instead of detecting radio waves in our immediate surroundings, you wanted to have a direct sensory awareness of how many page views your website is currently tracking? Or how much traffic is jamming up the local freeway? Or the minute-by-minute performance of the stock market?
The example of the stock market is one that has actually been tested by a neuroscientist named David Eagleman in recent years. Eagleman is a proponent of the expansion of normal human senses, and one of his projects is an adaptable sensory feedback garment called VEST (standing for “variable extra-sensory transducer”). The basic idea of VEST is that any data you want can be translated into coded patterns of vibration that are transmitted through the piece of clothing and felt on the back of the person wearing it. The original purpose was to help people with hearing disabilities “hear” sounds, including discernible words, through the patterns of vibration, but as Eagleman points out in a TED talk on the subject, the same tool can be used to give humans an intuitive, sensory awareness of any data set we want – including stock prices.
This raises interesting questions. For example, if you translate information that we normally consume as abstract numbers into a real-time sensory experience, can we gain new insights about that information? Would a person who is trained to “feel” the stock market eventually gain predictive powers or other intuitions that people who deal only with the abstract numbers never acquire access to? It's possible that the answer is "no," but even in that case, new methods of porting data directly to our senses could become important tools for educating ourselves about numerical realities and helping us get a “feel” for the facts.
Think of the concept of a graph, like a bar graph or a pie chart. Fundamentally, a graph gives you no information that wouldn't be provided by reading the numbers pictured in the graph straight off of a spreadsheet. But for most people, a graph can still elucidate trends and relationships in way that feels much more complete than data values on their own. And if we discover that other ways of directly confronting data with our senses are equally helpful, the Microsoft Excel of the future might have, in addition to “Add Graph,” essential options like “Hear Hum” or “Feel Buzz.”
Advertisement